


In September 2016, there was a large import of a module from South Korea destined for the Hebron offshore oil project in Newfoundland and Labrador. Excluding the $2.9 billion change in imports of industrial machinery, equipment and parts in September, total annual imports would have decreased 0.6% in 2016, resulting in an annual trade deficit of $23.1 billion.
On a quarterly basis, deficits in the first three quarters of 2016 were followed by a surplus of $42.0 million in the fourth quarter. Exports decreased in the first two quarters, particularly in the second quarter when exports fell 4.6% to $124.3 billion. The decline in the second quarter was mainly the result of lower exports of motor vehicles and parts as well as consumer goods. Exports increased in the third and fourth quarters of 2016, led by higher exports of energy products.
Imports increased in the first and third quarters of 2016 and declined in the second and fourth quarters. The import for the Hebron project in September led to a 2.5% increase in imports in the third quarter, followed by a 1.8% decline in the fourth quarter.
Annual export prices fell 1.9% in 2016 while volumes increased 1.3%. For imports, prices were down 0.2% and volumes edged up 0.1%. The Canadian dollar lost 3 US cents relative to the US dollar in 2016. The change in the annual average exchange rate had a lesser impact on import prices than it did in 2015, when the Canadian dollar lost 12 US cents relative to the US dollar from 2014.
The value of Canada’s total merchandise trade (exports plus imports) was down 0.4%, from $1,073 billion in 2015 to $1,069 billion in 2016. As a measure of openness to merchandise trade, the ratio of merchandise trade to nominal gross domestic product (up 2.0% to $2,027 billion in 2016) narrowed from 54.0% in 2015 to 52.7% in 2016. Canada’s terms of trade with the world declined 3.0% to 0.89 (reference year 2007), the fifth consecutive annual decrease.
Energy products lead the decline in annual exports in 2016
Total annual exports decreased 0.7% to $521.3 billion in 2016, the second consecutive decline since the record $528.4 billion reached in 2014. In 2016, lower exports of energy products and aircraft and other transportation equipment and parts were partially offset by higher exports of motor vehicles and parts. Exports excluding energy products increased 1.9%.
Exports of energy products fell in 2016, as exports of crude oil and crude bitumen fell 14.2% to $48.2 billion. Volumes of crude oil and crude bitumen were down 7.0% in the second quarter, due to the Fort McMurray wildfires in May. Despite the impact of the wildfires, annual volumes of crude oil and crude bitumen were up 2.7%.
Exports of aircraft and other transportation equipment and parts were down 5.6% to $23.5 billion. Aircraft exports fell 20.9% to $8.7 billion, the lowest value since 2013.
Partially offsetting these declines were higher exports of motor vehicles and parts, which rose 9.5% to $95.6 billion in 2016. The main contributor to the increase was passenger cars and light trucks, up 13.2% to $65.4 billion, the highest annual value since 2000. There was a record number of new vehicle units sold in the United States in 2016, driven by pickups, crossovers and sport utility vehicles.
Imports decline on lower energy product prices
Following six annual increases, imports edged down 0.1% to $547.3 billion in 2016. Lower imports of energy products and aircraft and other transportation equipment and parts were offset by higher imports of motor vehicles and parts.
Imports of energy products declined 10.8% to $27.5 billion, the lowest annual value since 2004. This reflects a sharp 15.8% decline in prices.
Imports of aircraft and other transportation equipment and parts decreased 11.8% to $18.8 billion. Aircraft imports fell 32.5% to $3.8 billion. Quarterly imports fluctuated widely over the course of the year.
These declines were offset by higher imports of motor vehicles and parts, which rose 6.2% to $106.7 billion. Overall, volumes increased 7.7% and prices declined 1.4%. Imports of motor vehicle engines and motor vehicle parts increased 9.7% to $45.5 billion, the highest value since 1999.
Annual real trade surplus widens in 2016
In real (or volume) terms, exports increased 1.3% to a record $484.4 billion in 2016, while imports edged up 0.1% to $476.3 billion. This was the seventh consecutive annual increase in real exports and imports. The trade surplus in real terms therefore widened from $2.4 billion in 2015 to $8.2 billion in 2016.
Deficit with non-US countries widens while surplus with the United States narrows
Imports from countries other than the United States increased 1.5% to a record $187.4 billion in 2016. Imports from South Korea rose 45.4%, attributable to the high-value shipment for the Hebron project. Imports from Algeria were up 100.7% on higher imports of crude oil and crude bitumen. These increases were partially offset by lower imports from China (-3.4%), led by electronic and electrical equipment and parts.
Exports to countries other than the United States increased 1.0% to a record $129.0 billion. Exports to the United Kingdom were up 8.8%, mainly unwrought gold. These increases were offset by lower exports to Hong Kong (-40.9%), also unwrought gold.
As a result, the trade deficit with countries other than the United States widened from $57.0 billion to a record $58.4 billion in 2016.
Imports from the United States represented 65.8% of Canada’s imports from the world in 2016, down from 66.3% in 2015. Meanwhile, the share of Canada’s exports to the United States edged down from 75.7% in 2015 to 75.2% in 2016. Historically, the United States’ share of Canada’s imports peaked at 77.0% in 1998, while exports peaked at 83.9% in 2002.
Canada’s imports from the United States declined 0.9% to $359.9 billion in 2016. Lower imports of energy products were partially offset by higher imports of motor vehicles and parts. Exports to the United States were down 1.2% to $392.3 billion in 2016. Lower exports of energy products were partially offset by higher exports of motor vehicles and parts. Consequently, Canada’s trade surplus with the United States narrowed from $34.0 billion in 2015 to $32.4 billion in 2016.
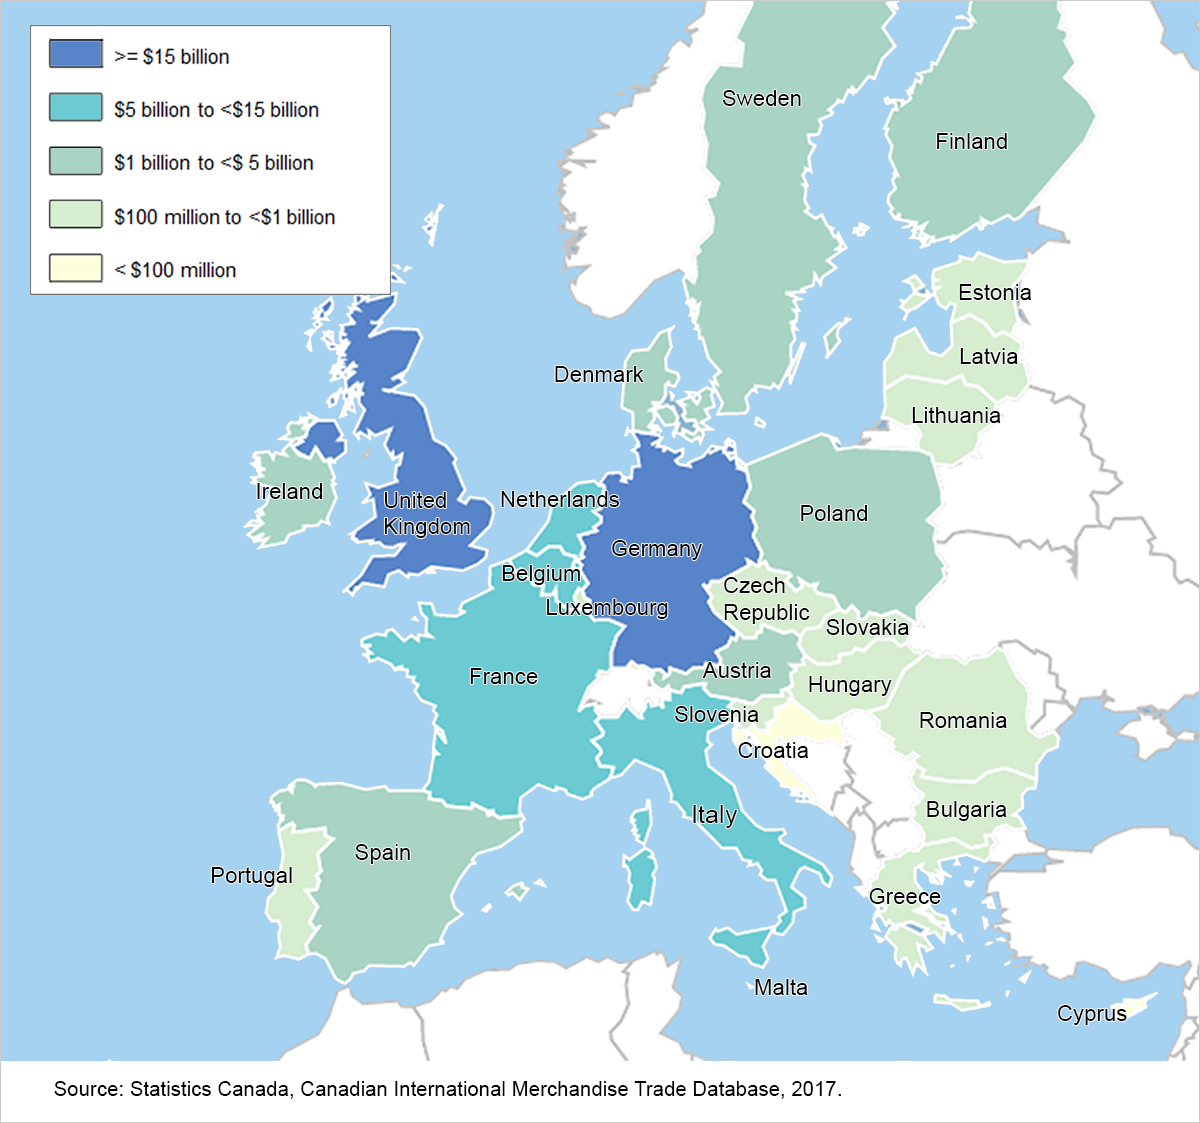
United Kingdom first among Canada’s European Union trading partners
On October 30, 2016, Canada and the European Union signed the Comprehensive Economic and Trade Agreement (CETA). The European Parliament voted on February 15, 2017, to approve the implementation of CETA. Once fully implemented (expected in 2024), this agreement will eliminate tariffs on almost 99% of goods traded between the two partners.
In 2016, total Canadian imports from the European Union were $52.3 billion and exports were $41.9 billion, representing 9.6% and 8.0% of Canada’s total imports and total exports with the world respectively. Compared with 2015, imports from the European Union were down 1.5% and exports were up 6.8%. Therefore, Canada’s annual merchandise trade deficit with the European Union narrowed from $13.9 billion in 2015 to $10.4 billion in 2016. Of the principal European Union trading partners, Canada held a trade surplus with two—the United Kingdom and Belgium.
Since 2006, Canada’s imports from the European Union have increased 24.4%. The top imported commodities from the European Union in 2016 were motor gasoline, aircraft engines and aircraft parts, as well as motor vehicles and parts.
Imports from Germany accounted for the largest share (27.9%) of Canada’s imports from the European Union in 2016, followed by the United Kingdom and Italy.
Passenger cars and light trucks comprised the largest proportion of imports from Germany, accounting for over one-quarter of imports from this country in 2016.
Imports from the United Kingdom accounted for 14.5% of Canada’s total imports from the European Union in 2016. Canada’s imports from the United Kingdom were led by aircraft engines and aircraft parts as well as passenger cars and light trucks.
Canada’s imports from Italy comprised 10.8% of imports from the European Union in 2016. Wine accounted for the largest proportion of Canada’s imports from Italy.
Since 2006, Canada’s exports to the European Union have increased 31.2%. The top exported commodities in 2016 were unwrought gold, aircraft and iron ores and concentrates.
While some European Union countries switched positions among Canada’s principal export destinations, the United Kingdom continued to dominate, accounting for 42.9% of Canada’s exports to the European Union in 2016.
Canada’s exports to the United Kingdom are mainly driven by unwrought gold, which represented about two-thirds of Canada’s exports to this country in 2016. Generally, the purpose of these shipments was either for sale following refining or for asset transfer.
Germany was the second main destination for Canada’s exports in 2016, accounting for 10.6% of total exports to the European Union. Aircraft and other transportation equipment and parts led exports to that country. France was third among European Union destinations in 2016 with an 8.4% share, on exports of aircraft engines and aircraft parts.
| 2015 | 2016 | 2015 to 2016 | 2015 to 2016 | |
|---|---|---|---|---|
| billions of dollars | billions of dollars | change in billions of dollars | % change | |
| Total exports | 524.9 | 521.3 | -3.6 | -0.7 |
| United States | 397.2 | 392.3 | -4.9 | -1.2 |
| China | 21.5 | 22.4 | 0.9 | 4.0 |
| Mexico | 7.8 | 8.9 | 1.1 | 14.1 |
| United Kingdom | 16.5 | 18.0 | 1.4 | 8.8 |
| Japan | 10.1 | 11.0 | 0.9 | 8.7 |
| Germany | 3.9 | 4.4 | 0.5 | 13.8 |
| South Korea | 4.2 | 4.6 | 0.4 | 9.8 |
| Hong Kong | 4.0 | 2.4 | -1.6 | -40.9 |
| Netherlands | 3.7 | 2.9 | -0.8 | -20.4 |
| France | 3.2 | 3.5 | 0.3 | 8.3 |
| Total imports | 547.9 | 547.3 | -0.6 | -0.1 |
| United States | 363.3 | 359.9 | -3.4 | -0.9 |
| China | 38.9 | 37.6 | -1.3 | -3.4 |
| Mexico | 18.4 | 18.9 | 0.5 | 2.9 |
| United Kingdom | 8.6 | 7.6 | -1.0 | -12.1 |
| Japan | 10.8 | 11.8 | 1.0 | 9.0 |
| Germany | 15.0 | 14.6 | -0.4 | -2.6 |
| South Korea | 6.2 | 9.0 | 2.8 | 45.4 |
| Hong Kong | 4.4 | 4.1 | -0.3 | -6.9 |
| Netherlands | 4.4 | 4.8 | 0.5 | 10.5 |
| France | 4.6 | 4.4 | -0.1 | -2.4 |
| Trade Balance | -23.0 | -26.0 | … | … |
| United States | 34.0 | 32.4 | … | … |
| China | -17.4 | -15.2 | … | … |
| Mexico | -10.6 | -10.0 | … | … |
| United Kingdom | 7.9 | 10.4 | … | … |
| Japan | -0.7 | -0.8 | … | … |
| Germany | -11.1 | -10.2 | … | … |
| South Korea | -1.9 | -4.3 | … | … |
| Hong Kong | -0.4 | -1.7 | … | … |
| Netherlands | -0.7 | -1.9 | … | … |
| France | -1.3 | -0.9 | … | … |
- Totals are not equal to the sum of their components.
- Countries listed are the top 10 principal trading partners of Canada based on annual 2015 total merchandise trade data.

