


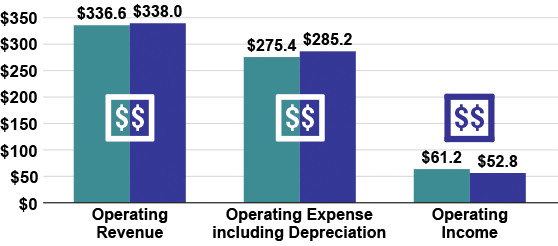
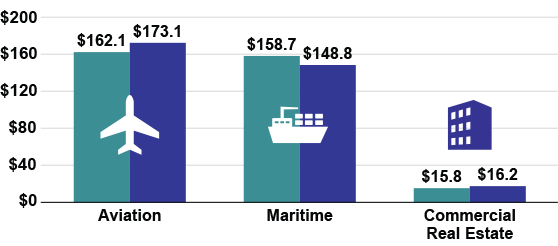
Operating Revenues by Division
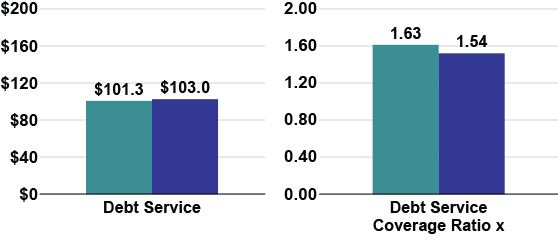
Debt Service & Debt Service Coverage Ratio
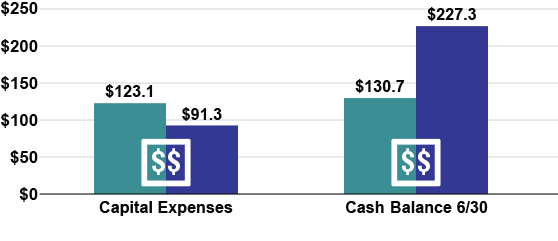
Capital Expense and Cash
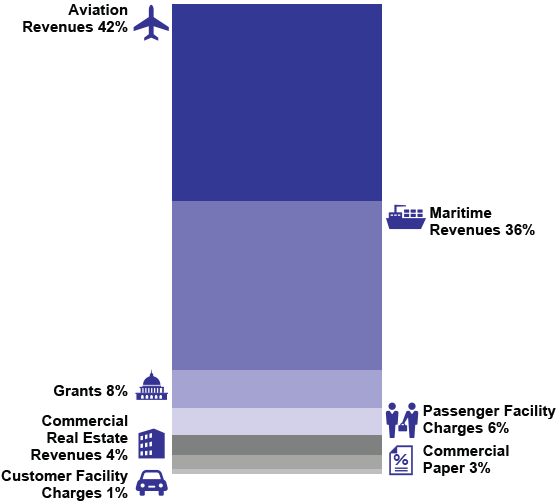
Port Sources of Funds
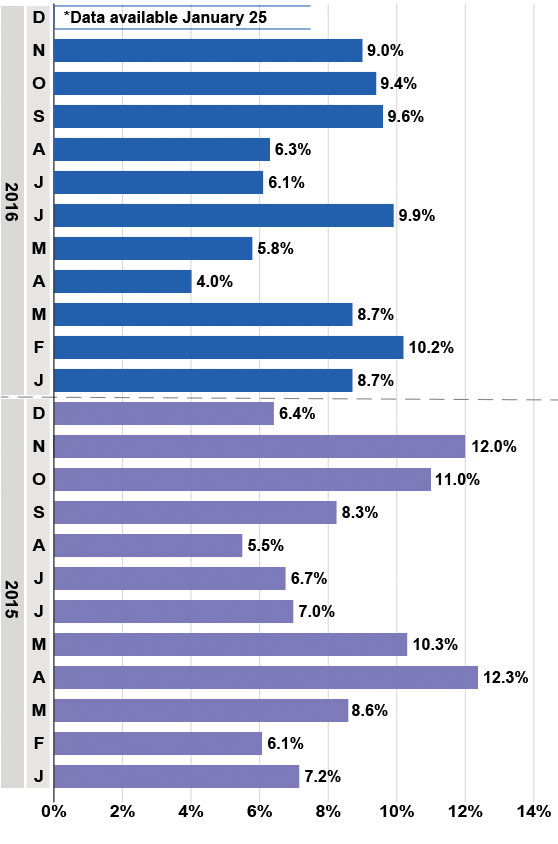
36 Consecutive Months of Airline Passenger Traffic Growth
Oak Monthly Passengers: Year over Year Growth
- 2015-2016 Growth: 7.9%*
- 2014-2015 Growth: 8.4%
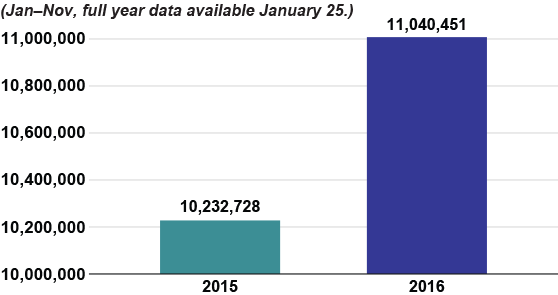
Passengers 2015 vs 2016
- Comparison to Prior Year: 7.9%*
Historical Passenger Activity
- 10 Year Compound Annual Growth Rate: (available January 25)
- 10 Year Total Growth: (available January 25)

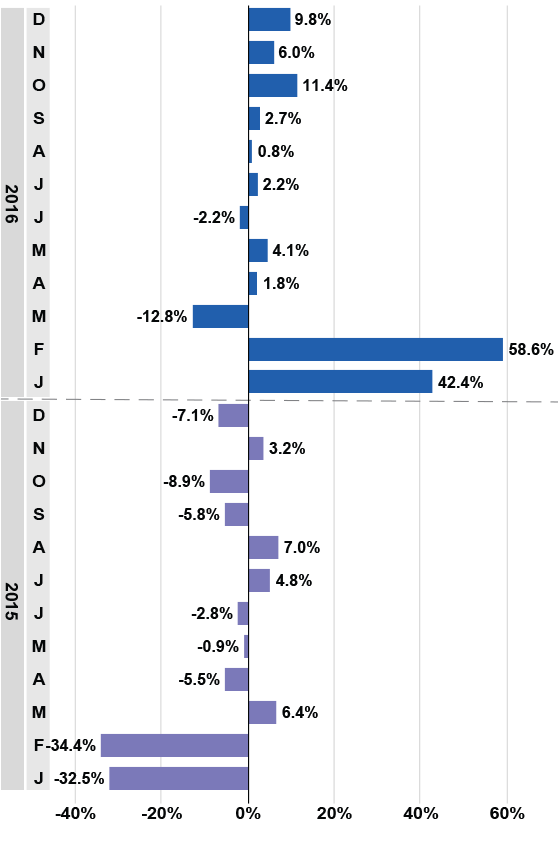
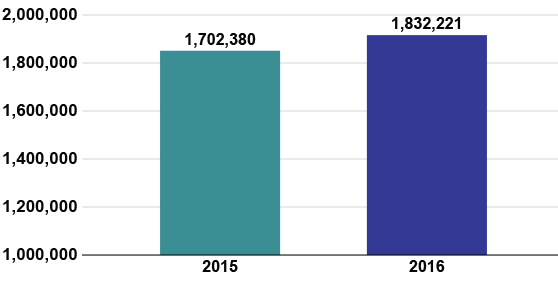
Port of Oakland Loaded Container Volume for 2016 Reaches All-time-High 1.83 Million TEUs
Monthly Full TEU Year over Year Growth
- 2015-2016 Full TEU Growth: 7.6%
- 2014-2015 Full TEU Growth: -6.2%
Full TEUs 2015 vs 2016
- Comparison to Prior Year: 7.6%
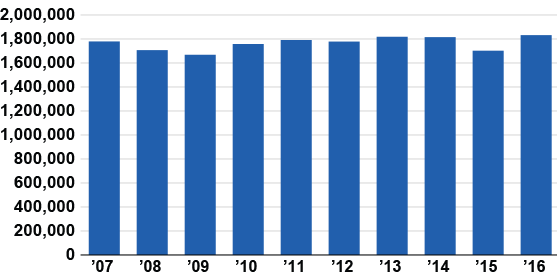
Historical Full TEU Activity
- 10 Year Compound Annual Growth Rate: 0.3%
- 10 Year Total Growth: 2.9%
Container Statistics
Port of Oakland TEU’s Activity 2016
| Month | Full | Empty | Grand Total | Trend* | ||||||
| Import | Trend* | Export | Trend* | Import | Trend* | Export | Trend* | |||
| January | 77,639 | 75.8% | 67,272 | 16.8% | 16,814 | -9.6% | 29,430 | 66.2% | 191,155 | 38.5% |
| February | 70,620 | 89.7% | 73,455 | 37.0% | 13,942 | -0.6% | 30,122 | 76.4% | 188,139 | 54.2% |
| March | 56,691 | -32.5% | 80,487 | 9.9% | 18,406 | -2.2% | 23,361 | -29.9% | 178,945 | -14.6% |
| April | 72,296 | -3.4% | 78,613 | 7.1% | 17,663 | 10.7% | 19,730 | -46.6% | 188,302 | -6.4% |
| May | 81,293 | 3.0% | 83,969 | 5.1% | 22,845 | 25.2% | 23,662 | -34.7% | 211,769 | -0.7% |
| June | 76,368 | 0.8% | 73,676 | -5.2% | 16,839 | -5.1% | 27,393 | -15.4% | 194,276 | -4.6% |
| July | 80,508 | 1.0% | 77,573 | 3.6% | 17,017 | 21.5% | 31,502 | -14.6% | 206,600 | 0.5% |
| August | 78,429 | -4.9% | 83,063 | 7.0% | 21,881 | 44.9% | 37,231 | -10.6% | 220,610 | 1.7% |
| September | 70,307 | -4.2% | 76,356 | 10.0% | 16,745 | 15.4% | 24,132 | -39.9% | 187,540 | -5.0% |
| October | 72,084 | 2.0% | 89,473 | 20.4% | 26,873 | 64.7% | 17,739 | -42.7% | 206,169 | 7.2% |
| November | 73,473 | 0.2% | 85,915 | 11.5% | 18,868 | 7.0% | 18,724 | -23.9% | 196,980 | 2.3% |
| December | 73,939 | 6.1% | 78,722 | 13.5% | 19,923 | 27.0% | 26,578 | -13.1% | 199,162 | 7.5% |
| YTD | 883,647 | 4.7% | 948,574 | 10.5% | 227,816 | 15.8% | 309,604 | -18.2% | 2,369,641 | 4.0% |
* Denotes change versus same time period from previous year
Source: portofoakland
Oakland2017-01-20

