


Ordering The Owners
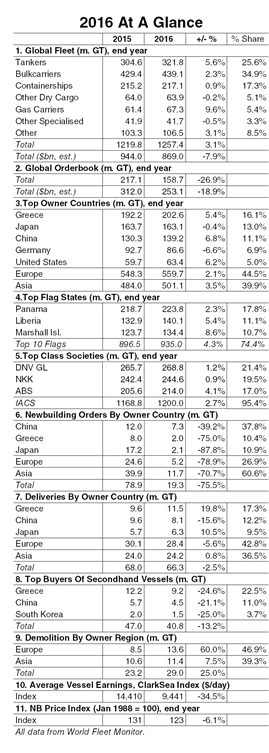
The global fleet grew by 3.1% in 2016 to 1,219.8m GT at the end of the year, its slowest pace of expansion since 2003. The European owned fleet grew 2.1% last year to 559.7m GT, maintaining a steady 44% share of the fleet. Meanwhile the Asian owned fleet saw faster growth of 3.5% over the same period to total 501.1m GT, 40% of the fleet. The Greek owned fleet remains the largest globally and grew by 5.4% over the course of 2016 to 202.6m GT. This reflects a 20% year-on-year rise in deliveries to Greek owners in 2016 (11.5m GT). An 11% rise in deliveries to Japanese owners in 2016 (6.3m GT) was balanced by a net 6.5m GT of secondhand sales and the Japanese owned fleet totalled 163.1m GT at the end of 2016, steady year-on-year. Meanwhile, the Chinese owned fleet grew 6.8% in 2016 to 139.2m GT, supported by 8.1m GT of deliveries and a net addition of 4.8m GT of secondhand units.
Segmenting Ship Sectors
Bulkcarrier and containership fleet growth slowed to 2.3% and 0.5% year-on-year in 2016, with the fleets totalling 439.1m GT and 217.1m GT at the end of the year respectively. Demolition activity was strong in 2016 and overall recycling volumes increased 25% year-on-year to a reported 29m GT. Bulkers accounted for 54% of last year’s demolition in GT terms while a record volume of boxship tonnage was reported recycled (7.6m GT). Tanker demolition was limited in 2016, at 1.5m GT, and deliveries in this sector were firm, increasing 68% year-on-year to 18.3m GT. This saw the tanker fleet grow by 5.6% during 2016 to 321.8m GT.
Flagging The Growth
The combined fleet of the top 10 flag states increased by 3.4% during 2016 to total 935m GT at the end of the year, equivalent to 74% of the global fleet. The Panamanian flag is by far the largest at 223.8m GT, accounting for 18% of the fleet, and grew by 2.3% over the course of 2016. However, the Marshall Islands and Liberia flagged fleets registered stronger growth of 8.6% and 5.4% respectively in 2016, reaching 134.4m GT and 140.1m GT at the end of last year.
Classing The Societies
The ranking of the top class society fleets was steady in 2016. DNV GL’s fleet totalled 268.8m GT at the end of last year, the largest classed fleet globally, up 1.2% on its end 2015 level. The NKK fleet is the second largest at 244.6m GT; it has grown 0.9% since the start of 2016. Meanwhile, the ABS classed fleet registered a faster pace of expansion last year, increasing 4.1% year-on-year to 214m GT. Overall, the IACS fleet grew by 2.7% over the course of 2016 to reach 1,200m GT at the end of the year. This is equivalent to 95% of the world fleet.
Fleet Diagnosis
So, on an aggregate level fleet growth continued to slow in 2016 with firm demolition counterbalancing steady delivery volumes. However, trends across owner countries, vessel sectors, flags and class societies were not uniform. While the general pattern was of slower growth, on closer inspection, as ever, in 2016 there were a wide range of dynamics at play in the world fleet.

